Landlord Partnership
Proposal
Premium Family Entertainment Concepts for Shopping Centers
- 26 Parks Worldwide
- 12+ Years of Experience
- 4 Unique Concepts
- Proven Traffic Generation
- Strong Financial Performance

Executive Summary
A proven, globally experienced entertainment operator seeking shopping center partnerships in the United States.
Parks Worldwide
Years Operating
Avg Revenue/Park
Zamania Group is a seasoned international entertainment operator with 26 parks across the Middle East and Europe, generating an average of ~$5.0M in annual revenue per park in the UAE. With over 12 years of operating history and four distinct entertainment concepts, we are uniquely positioned to serve as an anchor or semi-anchor tenant in U.S. shopping centers.
Our parks are purpose-built to drive foot traffic, extend dwell time, and create recurring visitation patterns for shopping centers, backed by full financial transparency and a commitment to fund all construction, development, and rent obligations through U.S.-based accounts prior to the start of any build-out.
Key Proposition
- Proven operator — 26 parks worldwide
- 4 scalable concepts
- Strong financials
- U.S.-based funding commitment
Operator Track Record
26 parks. 12+ years. Proven at scale across 3 continents.
Parks Operated
Years of Experience
Avg. Revenue/Park
Operational Capabilities
Awards & Recognition
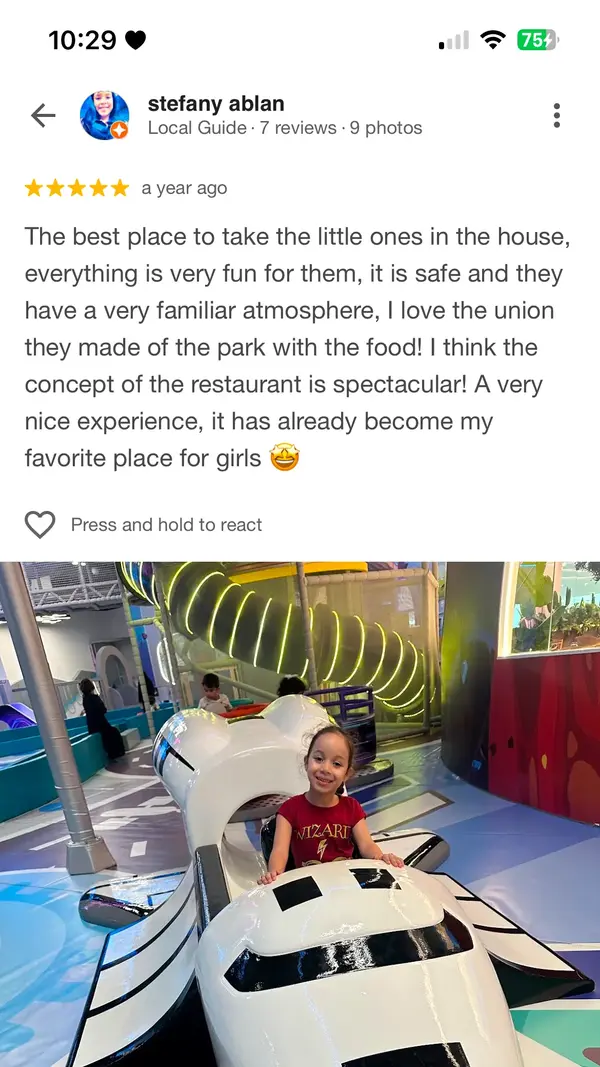
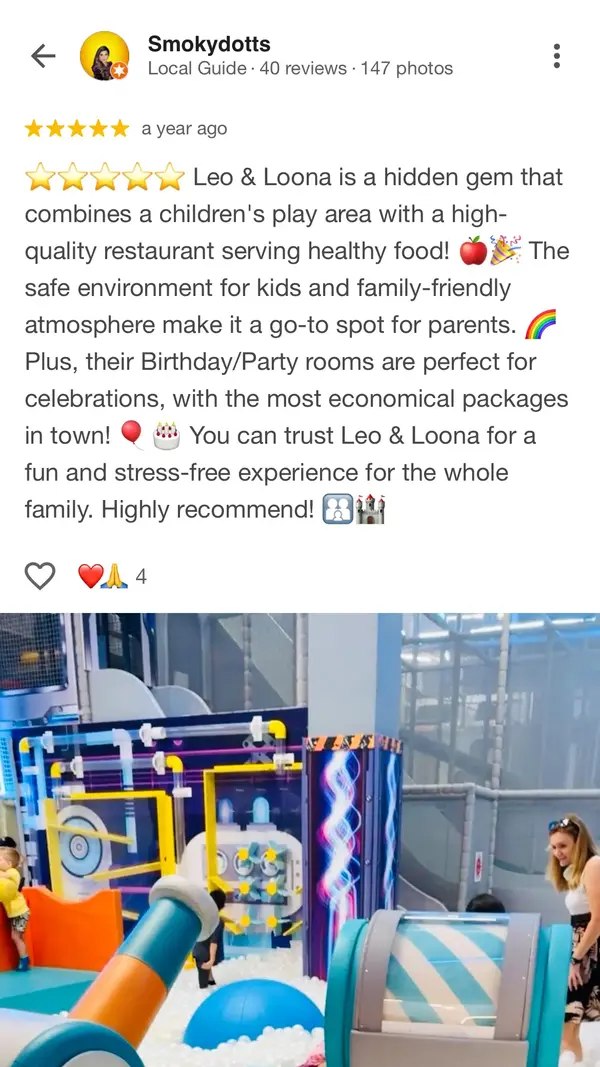
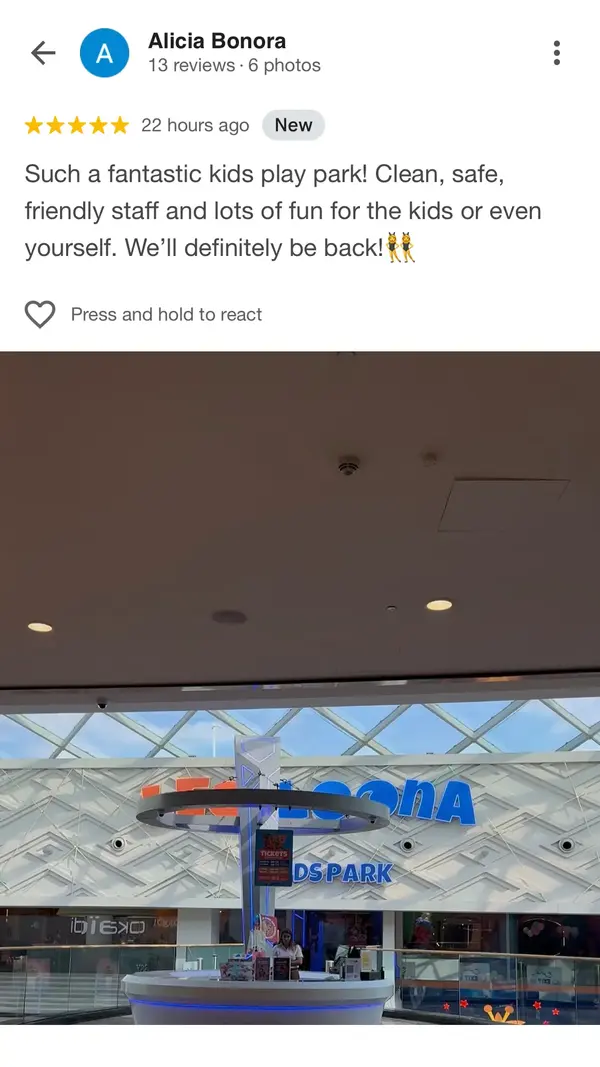
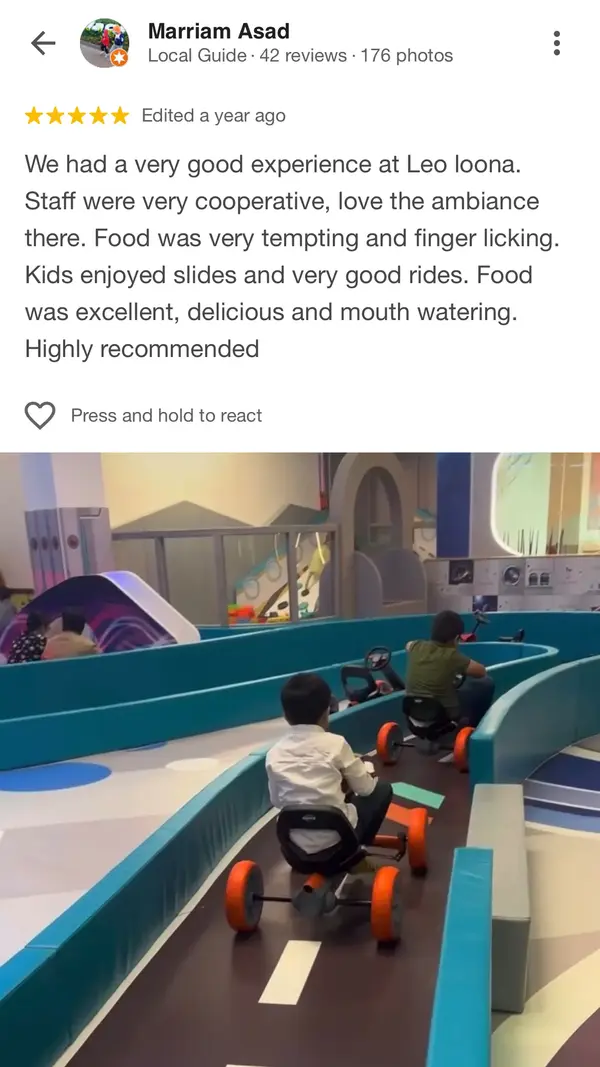
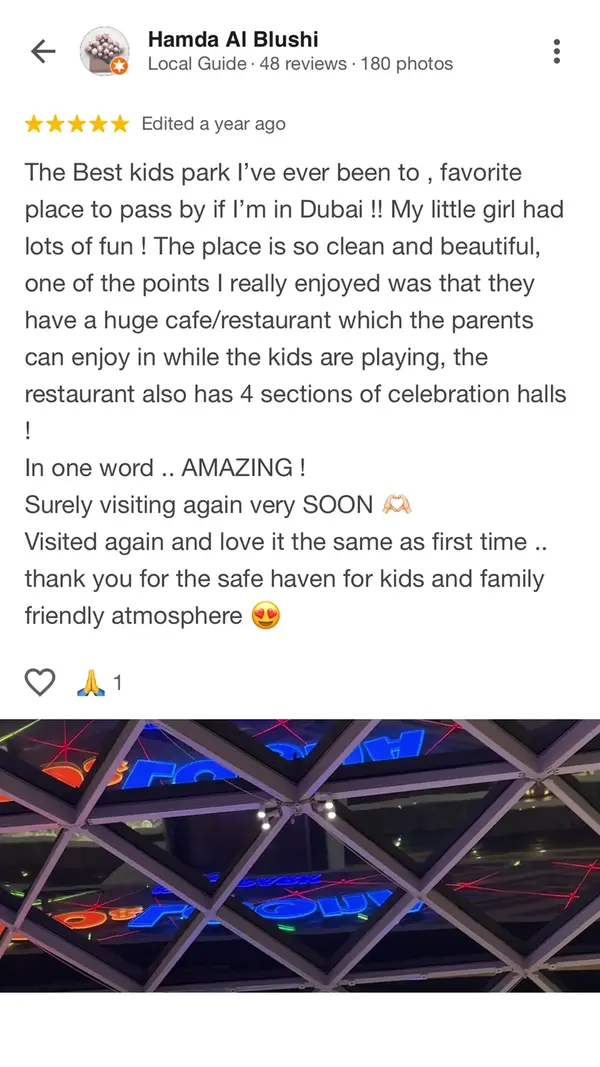
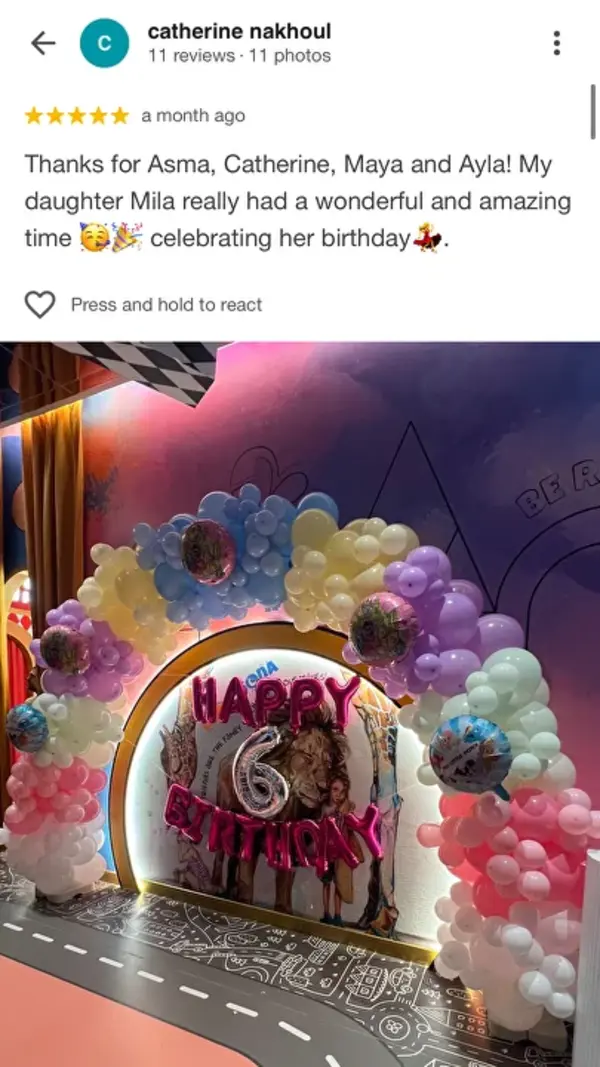
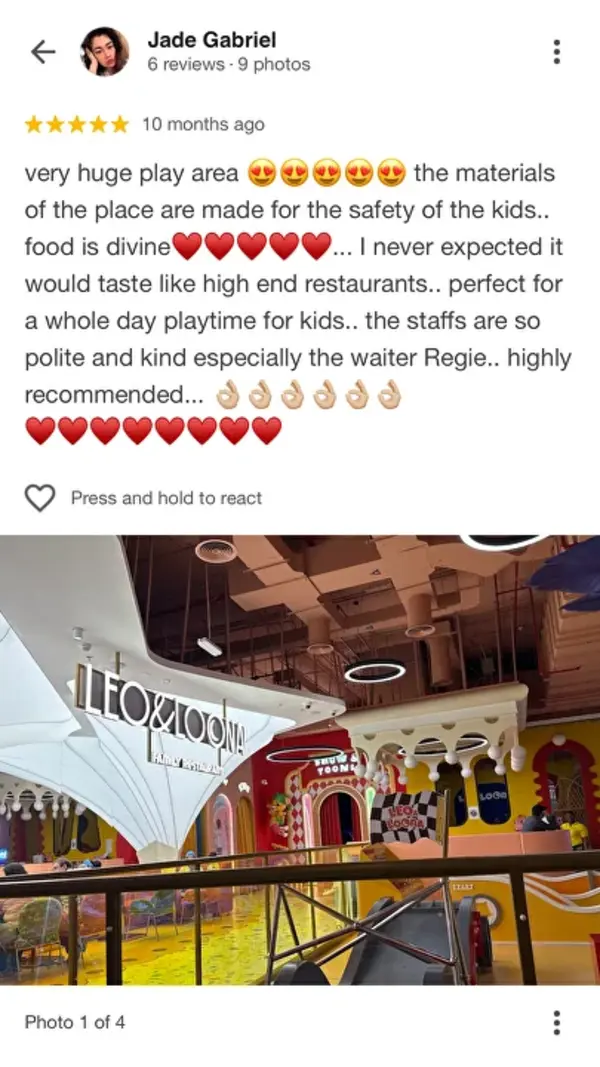
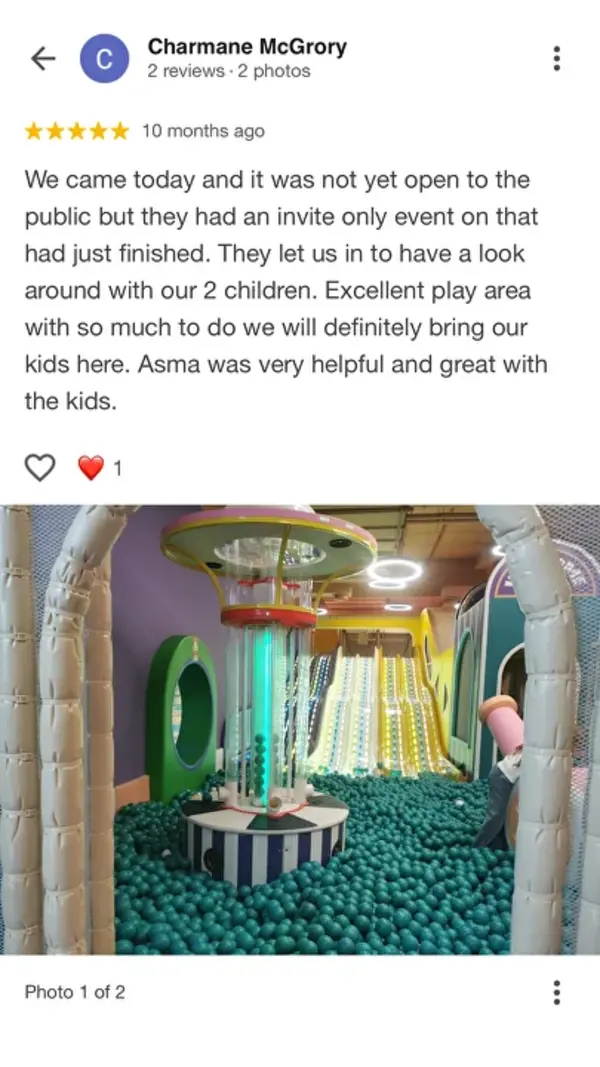
What Visitors Say About Our Parks
Our Concepts
Four distinct entertainment brands designed to serve different demographics, center profiles, and market segments.
Premium toddler/preschool entertainment
Sportainment, active play and interactive entertainment
A "phygital" entertainment concept combining physical play with interactive digital projections
Next-generation concept combining AI, immersive environments, and interactive entertainment
Concept Gallery
Value Proposition to Shopping Centers
Our parks transform shopping centers into family destinations, driving traffic, extending dwell time, and increasing cross-shopping revenue.
Traffic Generation
Proven visitation data from one of our parks
Leo & Loona Festival Mall — Visitation Data
Period: 2025
Avg. Monthly Visits
Peak Month Visits
Annualized Run Rate
Monthly Visitation Trend
A single Leo & Loona park generates ~125K ticketed child visits per year in the UAE. These figures represent park tickets only and do not include accompanying adult visitors who spend time in the park and the shopping center, significantly amplifying the total foot traffic impact.
Unit Economics
Projected economics for the proposed park concepts in the US of average size.
Key Financial Projections
Park Size
25,000+ SF
Build-Out Cost
~$5.0M
~$250/SF incl. attractions & FF&E
Projected Annual Revenue
$5.0M+
At mature operation
Avg. Ticket Price
~$35
Per child
Revenue per Visit
$70–$85
Including add-ons
Annual Visits
100K–150K
Projected
Growth Roadmap
2 flagship parks — prove the U.S. model
6 parks (3 owned + 3 franchise) — demonstrate scalability
10 new parks/year (franchise) — national footprint
Seven Revenue Streams
Built-in repeat mechanics. Multiple monetization layers.
Multi-stream revenue model ensures stable income regardless of seasonal fluctuations — memberships and programs provide predictable recurring revenue year-round.
Additional Visitor Drivers
Beyond general admission — targeted programs that drive consistent weekday and off-peak traffic to the shopping center.
School Trips
- ●Structured STEM and educational field trip programs for K-8 schools
- ●100-300 students per visit during weekday off-peak hours
- ●Curriculum-aligned programming increases school adoption rates
- ●Parents receive follow-up engagement driving future family visits
Membership Models
- ●Monthly and annual memberships with exclusive perks and priority access
- ●Members visit 15-20x per year vs. 2-3x for casual visitors
- ●Predictable recurring revenue that smooths seasonal fluctuations
- ●Membership holders spend 40% more per visit on add-ons and F&B
Weekday Programming
- ●After-school programs, workshops, and AI learning camps
- ●Parent-and-toddler morning sessions (Leo & Loona)
- ●Homeschool group packages and specialized weekday pricing
- ●Corporate team-building events during business hours
Events & Parties
- ●Premium birthday party packages with themed experiences
- ●8-15 families per party, each a new customer acquisition opportunity
- ●Seasonal events: holiday camps, summer programs, AI festivals
- ●Community events and partnerships with local organizations
Gap Analysis
Our proprietary market analysis identifies significant gaps in the family entertainment landscape across target U.S. markets. The interactive map below highlights areas with strong demographic demand but insufficient entertainment supply.
Based on this gap analysis, our priority locations for 2026–2027 are Southern California, the Bay Area, Phoenix, Dallas, North Miami, New York, Salt Lake City, Seattle, and several other markets.
Gap Analysis — Interactive Map
Development Process & Funding
A streamlined development process backed by U.S.-based funding and proven execution capabilities.
Lease Negotiation & Design
8-12 weeksSite assessment, LOI, lease execution, schematic design
Permitting & Engineering
8-12 weeksConstruction documents, permits, MEP engineering
Construction & Fit-Out
20-28 weeksBuild-out, attraction installation, technology integration
Pre-Opening & Launch
4 weeksStaff hiring/training, soft opening, marketing campaign
Total Timeline
40-56 weeksFrom lease signing to grand opening
Funding & Investment
Tenant Improvement Allowance Required
As a premium entertainment tenant making a significant capital investment in attraction build-out, technology infrastructure, and specialized construction, we request a competitive Tenant Improvement Allowance (TIA) commensurate with the scope of our investment and the long-term value our parks bring to the shopping center.
Site Requirements Matrix
Technical specifications for each concept to help identify the right fit for your shopping center.
| Requirement | Leo & Loona | Zamania | AI Experience Park |
|---|---|---|---|
| Size (SF) | 25,000-40,000 | 30,000-60,000 | 15,000-30,000 |
| Target Age | 1-8 years | 7-14 years | 4-99 years |
| Ceiling Height | 18 ft+ min | 20 ft+ preferred | 18 ft+ preferred |
| Power Requirement | 600A / 3-phase | 800A / 3-phase | 800A / 3-phase |
| HVAC | 1 ton per 325 SF | 1 ton per 325 SF | 1 ton per 325 SF |
| Parking Ratio | 5:1000 SF | 5:1000 SF | 5:1000 SF |
| Preferred Location | Ground/L1 | Ground/L1-L2 | Ground/L1-L2 |
| Build Cost (PSF) | ~$200 | ~$200-250 | ~$250+ |